Performance8 min read
How to find and fix slow WordPress database queries
Find WordPress slow database queries, read EXPLAIN plans, fix common query patterns, add safer indexes, and cache expensive results correctly.
 By Hamza Ahmad AslamWordPress VIP, Performance & Full-Stack Engineer
On this page
- How to find WordPress slow database queries
- How to read EXPLAIN for a WordPress query
- Which query patterns commonly cause slow WordPress queries?
- Meta queries that filter on meta_value
- LIKE searches that start with a wildcard
- ORDER BY RAND()
- Counting found rows when the total is not needed
- Unbounded queries
- Queries inside loops
- A large autoloaded options set
- When should you add an index to wp_postmeta?
- How should you cache an expensive query result?
- What changes for WooCommerce product queries?
- What should you do next?
- Frequently asked questions
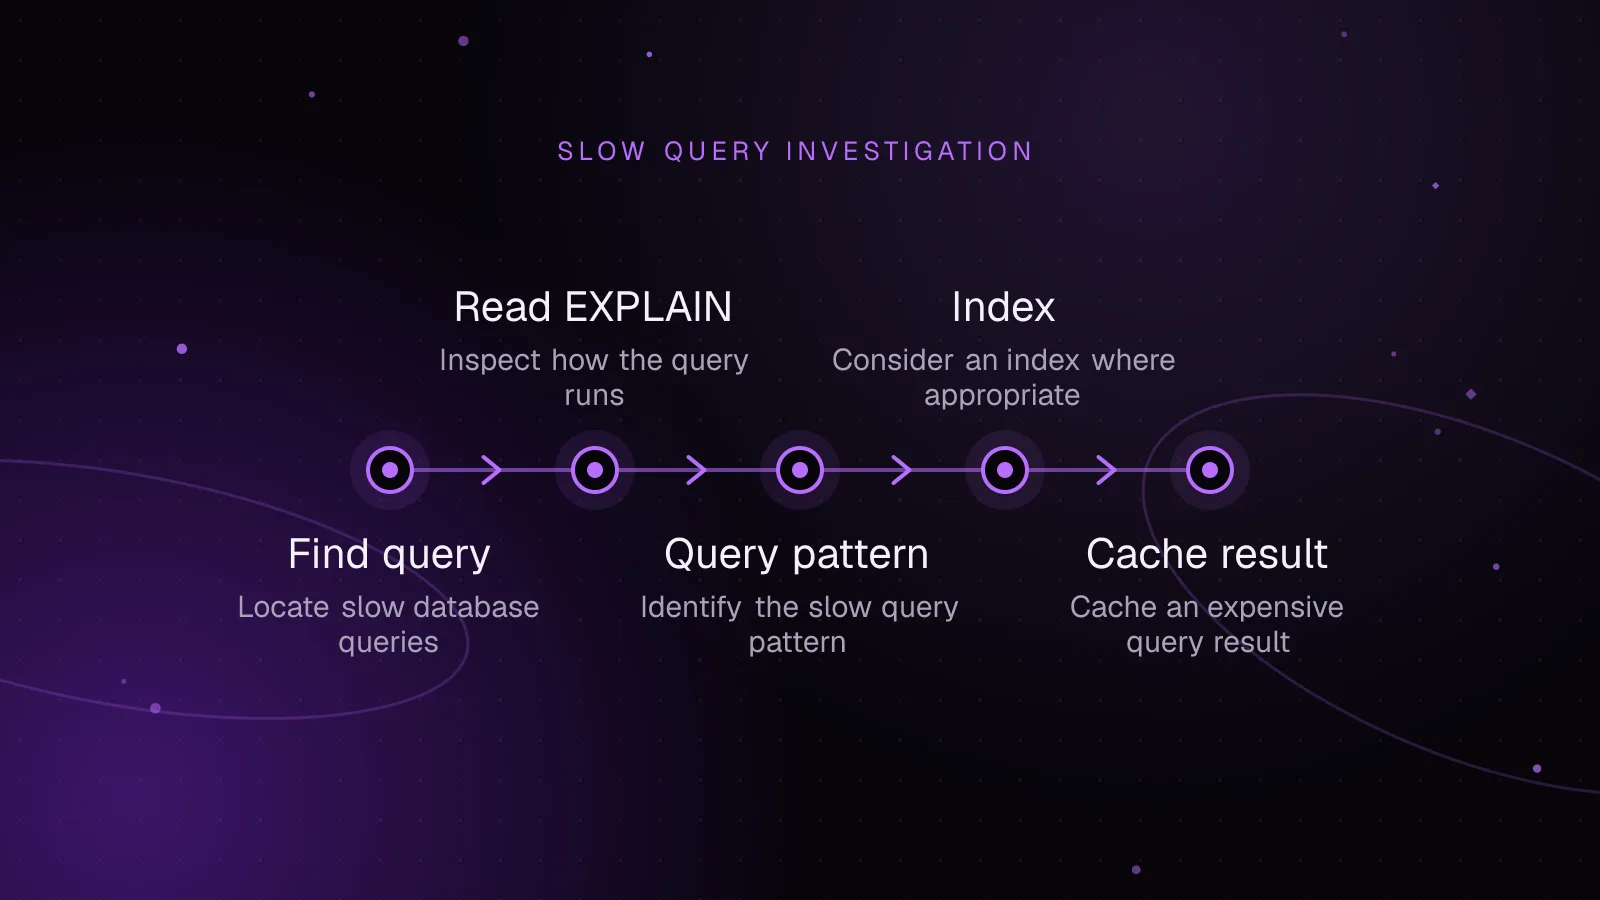
Short answer: WordPress slow database queries are usually found by measuring the actual SQL, its execution time, and how often it runs before changing indexes or code. Use Query Monitor for one WordPress request, the MySQL slow query log for traffic over time, then use EXPLAIN to see why a repeated query reads more rows than it should.
How to find WordPress slow database queries
Start at the request that feels slow. Query Monitor records database queries for the current request, including execution time, calling function, responsible component, duplicate queries, errors, and slow-query notifications.
That makes Query Monitor useful for a slow product page, admin screen, REST request, or AJAX request you can reproduce. Sort or filter the query list, then look for three patterns: one expensive query, many copies of the same query, or many individually cheap queries from one caller.
Duplicate queries often point to application code rather than an indexing problem. If a template calls the same lookup inside a loop, making the SQL faster still leaves unnecessary work. Fix the repeated call or load the needed data once.
Query Monitor only shows the request you are inspecting. To catch slow WordPress queries across real traffic, use the MySQL slow query log. In MySQL 8.4, slow_query_log defaults to OFF, while long_query_time defaults to 10 seconds. The MySQL slow query log documentation (opens in a new tab) explains both settings.
A temporary diagnostic configuration can use a lower threshold:
[mysqld]
slow_query_log = ON
slow_query_log_file = /var/log/mysql/mysql-slow.log
long_query_time = 1.0
Choose the threshold for the incident you are investigating, and watch log volume. A one-second threshold is an example, not a universal target. MySQL notes that very small values can create large logs, so short diagnostic windows are safer on busy production servers.
Managed hosts may expose the MySQL slow query log through their control panel instead of the server filesystem. Use the host's supported path rather than changing database configuration you do not own.
How to read EXPLAIN for a WordPress query
EXPLAIN shows the optimizer's plan without making you guess which index MySQL intends to use. The MySQL EXPLAIN output reference (opens in a new tab) defines the columns and access methods.
Consider an illustrative product query that filters a numeric value stored in post meta:
EXPLAIN
SELECT p.ID
FROM wp_posts AS p
INNER JOIN wp_postmeta AS pm
    ON p.ID = pm.post_id
WHERE p.post_type = 'product'
  AND p.post_status = 'publish'
  AND pm.meta_key = '_example_score'
  AND CAST(pm.meta_value AS UNSIGNED) >= 80
ORDER BY p.post_date DESC
LIMIT 20;
Example output, with values chosen only to illustrate how to read the plan:
+-------+--------+------------------+----------+--------------------------------+
| table | type   | key              | rows     | Extra                          |
+-------+--------+------------------+----------+--------------------------------+
| pm    | ref    | meta_key         | 82000    | Using where; Using filesort    |
| p     | eq_ref | PRIMARY          | 1        | Using where                    |
+-------+--------+------------------+----------+--------------------------------+
Read four fields first. type is the access method. ALL means a full table scan, while ref, range, and eq_ref usually indicate more selective access. Do not judge the query from type alone.
key is the index MySQL chose. A NULL value means no index was selected for that table. rows is MySQL's estimate of rows it expects to examine, so a large estimate on a hot query deserves attention.
Extra explains more work. Using filesort means MySQL needs an extra sorting step. Using temporary can indicate an internal temporary table. Neither is automatically a bug, but both matter when the affected row set is large.
Run EXPLAIN on the exact SQL captured from the slow request. After each change, compare the plan and request timing again.
Which query patterns commonly cause slow WordPress queries?
Meta queries that filter on meta_value
WP_Query can turn a meta_query into joins against wp_postmeta. The problem is often the value comparison. Core does not provide a general index on meta_value, which is a longtext column.
If an application frequently filters or sorts large datasets by a typed value, move that field to a purpose-built table with an appropriate column type and index. For smaller datasets, reduce the candidate set first with indexed post fields, taxonomy terms, or another selective condition.
LIKE searches that start with a wildcard
A predicate such as LIKE '%term%' cannot use a normal BTREE index as a range starting point. MySQL can use range access for a constant LIKE pattern when the pattern does not begin with a wildcard.
Prefer prefix searches such as LIKE 'term%' when the product requirement allows it. For true substring search across large content, use a search system designed for that job rather than forcing repeated scans through WordPress tables.
ORDER BY RAND()
WordPress supports 'orderby' => 'rand', but random ordering makes the database produce a randomized result set before applying the limit. That becomes costly when the candidate set is large.
For a small rotating feature, cache a bounded set of candidate IDs and choose from that set in PHP. Another option is to precompute a rotation or random key instead of re-randomizing a large table on every request.
Counting found rows when the total is not needed
WP_Query has a no_found_rows argument. Its documented default is false; setting it to true tells WordPress to skip counting the total rows found when you do not need pagination. See the WP_Query reference (opens in a new tab) for the current behavior.
Before, a widget that only needs the latest items might ask for everything:
$args = [
    'post_type'      => 'news_item',
    'post_status'    => 'publish',
    'posts_per_page' => -1,
    'orderby'        => 'date',
    'order'          => 'DESC',
];
After, bound the result and skip the total count because the widget does not paginate:
$args = [
    'post_type'      => 'news_item',
    'post_status'    => 'publish',
    'posts_per_page' => 20,
    'orderby'        => 'date',
    'order'          => 'DESC',
    'no_found_rows'  => true,
];
posts_per_page => -1 explicitly requests all matching posts, so it should be reserved for cases that need every row.
Unbounded queries
An unbounded query grows with the site. A query that looks harmless with a few hundred rows can become a memory, network, and database problem after years of content growth.
Set a defined limit. For batch jobs, process stable pages or ID ranges instead of loading every object at once. If the caller only needs IDs, request IDs rather than full post objects where the API supports it.
Queries inside loops
A query inside a rendering loop creates an N+1 pattern. Ten rows can cause ten extra queries, and a larger page multiplies the cost.
Load related data before the loop, use WordPress APIs that prime caches, or collect IDs and issue one bulk query. Query Monitor's caller and duplicate-query views are useful here because the same call stack often appears repeatedly.
A large autoloaded options set
WordPress loads autoloaded options early so commonly used settings do not need separate queries. Loading too much unused option data increases database transfer and PHP memory work on many requests.
Since WordPress 6.6, the Options API can dynamically avoid autoloading large newly added options when the caller does not explicitly choose an autoload value. WordPress 6.6 also added a Site Health check for excessive autoloaded data. Use the autoloaded options diagnostic guide to measure the current set before changing flags.
When should you add an index to wp_postmeta?
Current WordPress core defines wp_postmeta with a primary key on meta_id, a normal index on post_id, and an index on the first 191 characters of meta_key. The current schema is visible in wp_get_db_schema() (opens in a new tab). The table prefix may differ from wp_.
That schema explains why adding another index to meta_value is not an automatic fix. A longtext field may hold strings, numbers, serialized values, dates, or unrelated plugin data. One generic index cannot make every meta comparison efficient.
Add an index only after a captured query and its EXPLAIN plan show a repeatable access pattern the index can improve. A composite index can help when the same columns are used together in selective equality or join conditions, but it also adds storage and write cost.
Test schema changes on staging with production-like data. Measure query plans and request behavior before and after. Document custom indexes, keep a rollback statement, and re-check them after WordPress upgrades because core upgrades can alter core table schemas.
For heavily queried business data, a custom table with typed columns is often easier to index correctly than continuing to stretch wp_postmeta.
How should you cache an expensive query result?
Caching is useful after the query is correct. It is not a substitute for fixing a scan that still runs on every cache miss.
WordPress provides wp_cache_get() and wp_cache_set() for the Object Cache. By default, the object cache lasts for one request unless a persistent object-cache drop-in is installed. For cross-request caching, a persistent backend such as Redis makes the same API useful across requests. See the Redis object cache setup and measurement guide for that layer.
This example asks the cache backend to expire a list of product IDs after five minutes. Without a persistent object cache, the entry still disappears at the end of the request. It uses the $found argument so a cached false-like value is not mistaken for a miss:
function my_featured_product_ids() {
    $key   = 'featured_product_ids_v1';
    $group = 'my_plugin';

    $ids = wp_cache_get( $key, $group, false, $found );

    if ( $found ) {
        return $ids;
    }

    $ids = get_posts(
        [
            'post_type'      => 'product',
            'post_status'    => 'publish',
            'posts_per_page' => 20,
            'fields'         => 'ids',
            'no_found_rows'  => true,
        ]
    );

    wp_cache_set( $key, $ids, $group, 300 );

    return $ids;
}
Expiration limits staleness, but correct invalidation is better. Delete or replace the cache key when the data that defines the result changes. If several write paths can change the result, every one of those paths must invalidate it.
Transients are another option for temporary cached data. Without a persistent object cache, transients are stored in the database. With one, WordPress can store them in the external object cache. Pick the API based on the persistence and invalidation behavior you need.
What changes for WooCommerce product queries?
WooCommerce uses lookup tables so common catalog operations do not have to derive everything from post meta. Since WooCommerce 3.6, wc_product_meta_lookup has held product data used for operations such as filtering, sorting, stock, SKU, and price queries. WooCommerce's 3.6 performance notes (opens in a new tab) document that table.
WooCommerce also uses wc_product_attributes_lookup for catalog attribute filtering. The actual names include the site's database prefix, so a default-prefix installation uses wp_wc_product_meta_lookup and wp_wc_product_attributes_lookup.
If a slow product query comes from custom code, first check whether WooCommerce already exposes a product query API or lookup table for the operation. Directly rebuilding price, stock, or attribute filtering against wp_postmeta can bypass work WooCommerce has already done to make those reads cheaper.
Do not write directly to lookup tables as the source of truth. Use WooCommerce CRUD APIs so its data stores can keep derived data synchronized.
What should you do next?
Take one slow URL and trace its database work before changing MySQL or adding indexes. If the page remains slow after the expensive queries are fixed, follow the WordPress TTFB diagnostic guide to separate database time from PHP, cache, network, and upstream delays.
If the remaining work spans query design, object caching, autoload cleanup, and production measurement, the WordPress performance optimization service covers that investigation as one performance problem rather than isolated tweaks.
Frequently asked questions
How do I know if MySQL is the reason WordPress is slow?
Capture the slow request with Query Monitor and compare database time with total request time. If SQL time is small but the request is still slow, investigate PHP execution, remote HTTP calls, object cache misses, and other TTFB layers.
Should I index wp_postmeta meta_value?
Usually not as a generic fix. meta_value is a longtext column containing mixed data, so a useful index depends on a specific query shape and data type. For frequent numeric or range filters, a typed custom table is often a cleaner design.
Can Query Monitor find every slow database query?
Query Monitor is strongest for the request you are actively inspecting and can flag slow or duplicate queries there. Use the MySQL slow query log when you need evidence collected across many requests and real traffic over time.
Does Redis fix slow database queries in WordPress?
Redis can avoid repeated database work when results or objects are cacheable, but it does not repair an inefficient SQL plan. Fix the query and invalidation rules first, then measure whether persistent object caching removes enough repeated reads to matter.
Share this article
Enjoyed this? Get the next article by email.
Keep reading
 Performance
8 min read
How to fix a slow WordPress admin dashboard without guesswork
Fix slow WordPress admin screens by timing requests, tracing queries, checking cron, AJAX, autoloaded options, HTTP calls, and memory.
- WordPress
- wp-admin
- Query Monitor
 Performance
7 min read
How to reduce WordPress TTFB: a diagnostic guide
Reduce WordPress TTFB by separating CDN, network, PHP-FPM, database, cache, and WordPress delays with repeatable diagnostic tests.
- WordPress
- TTFB
- Performance
 Performance
6 min read
Why a cache purge can overload WordPress and how to stop it
Stop a WordPress cache stampede by controlling rebuilds, serving stale data, spreading expiries, and tracing origin and database load after purges.
- WordPress
- Caching
- Performance