Performance8 min read
Fix INP in WordPress by finding the slow interaction
Fix INP in WordPress by reproducing slow taps and typing, splitting delay into three phases, tracing the long task, and checking field context.
 By Hamza Ahmad AslamAI & WordPress Developer | Speed Optimization & Site Security
On this page
- Fix INP in WordPress by tracing one interaction
- Choose interactions that represent what visitors do
- Freeze the mobile setup before you compare traces
- Record a repeatable menu and form test
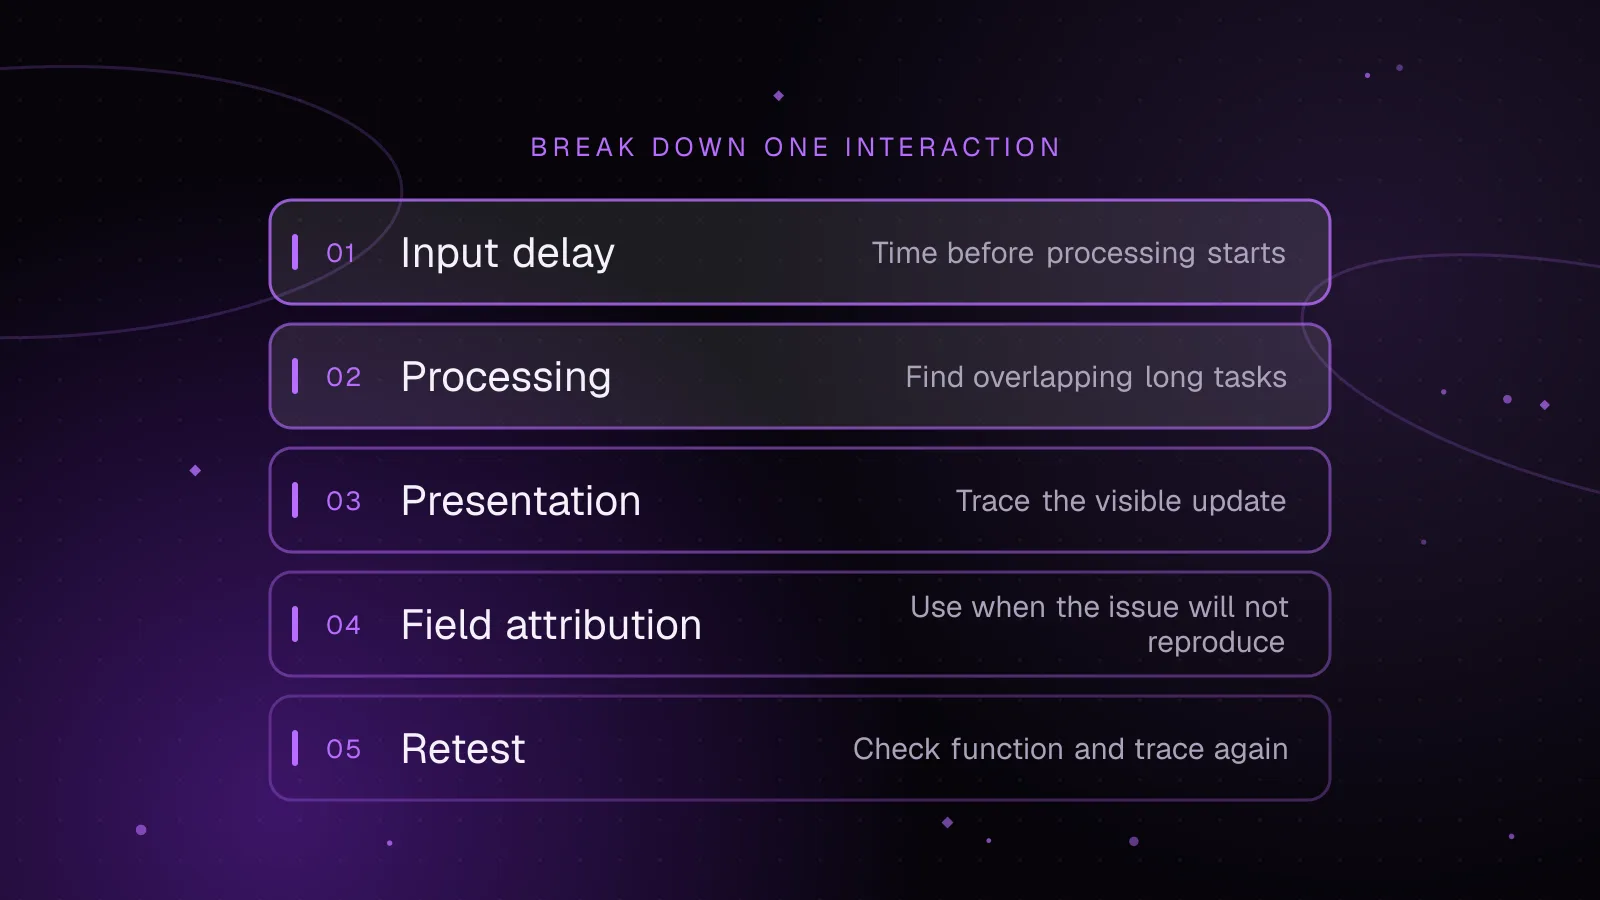
- Split the delay into input, processing, and presentation
- Isolate the long task that overlaps the interaction
- Use field attribution when the slow interaction will not reproduce
- Can content-visibility improve INP in WordPress?
- Retest the function before you trust the faster trace
- Decide what to fix next
- Frequently asked questions
To fix INP in WordPress, start by reproducing the exact tap or key interaction that feels slow, then record it in Chrome DevTools and split its delay into input, processing, and presentation. Trace the slowest phase to the main-thread task that overlaps it, make one controlled change, and repeat the same mobile interaction before looking for confirmation in field data.
Fix INP in WordPress by tracing one interaction
INP measures the latency of clicks, taps, and keyboard interactions across a page visit. For most visits, the slowest interaction becomes the page's INP candidate, with outlier handling for pages that have many interactions. Google evaluates the field result at the 75th percentile of page loads, split between mobile and desktop, with 200 ms or less classed as good and more than 500 ms as poor. The official INP reference (opens in a new tab) explains the calculation and thresholds.
That definition points to the first diagnostic rule: do not optimize a generic "speed score." Find the interaction.
Choose interactions that represent what visitors do
Start with controls that can change the page after it has loaded. On a typical WordPress site, useful candidates include:
- Open and close the mobile menu.
- Type into the first meaningful form field.
- Open a search, filter, accordion, modal, or account control.
- Accept or reject a consent choice if that action starts other scripts.
- Submit a form or advance to its next step.
If field data or your own monitoring identifies a page or interaction target, start there. If it does not, choose the busiest page templates and the interactions a visitor is most likely to use.
A fast loading page can still feel laggy. Loading and responsiveness measure different work. A page can finish its initial render, then run expensive JavaScript or rendering work when a visitor taps a menu or presses a key.
Freeze the mobile setup before you compare traces
Use the same physical phone for the baseline and the retest. Record the setup before you touch code.
Mobile interaction setup
Device model: [record]
OS version: [record]
Chrome version: [record]
Network: [record]
Page URL or template: [record]
Logged-in state: [record]
Consent state: [record]
Form or cart state: [record]
Keep those conditions the same for the before and after trace. The goal is repeatability, not a synthetic score that happens to be green.
Record a repeatable menu and form test
Run one interaction per Performance recording. Open the page in the same state, start a recording, perform the gesture, wait for the visual response, then stop. Repeat the same action after your controlled change.
The table below is an illustrative worksheet. Replace every bracketed field with your own trace data.
| Scenario | Exact gesture | Before trace | Dominant phase | Overlapping task or render work | One controlled change | Expected after change | Function check |
|---|---|---|---|---|---|---|---|
| Illustrative: mobile menu | Tap menu button once | [record] | [input / processing / presentation] | [script, function, layout or paint] | [change one cause] | Same menu behavior with less delay in the targeted phase | Open, close, focus, Escape or keyboard control |
| Illustrative: form typing | Focus first field and type the same text | [record] | [record] | [record] | [change one cause] | Typing stays responsive and validation still runs | Keyboard typing, Tab order, validation |
| Illustrative: consent action | Tap the same consent choice | [record] | [record] | [record] | [change one cause] | Choice still applies and any permitted scripts start as designed | Consent state and dependent scripts |
| Illustrative: analytics-sensitive action | Repeat the menu or form action that emits analytics | [record] | [record] | [record] | [change one cause] | Interaction improves without dropping or duplicating the intended event | Analytics event count and payload shape |
Do not combine several changes before the retest. If you remove a listener, delay a script, alter a DOM update, and change CSS at once, the faster trace will not tell you which change mattered.
Split the delay into input, processing, and presentation
Every measured interaction has three parts. The web.dev INP optimization guide (opens in a new tab) defines them as input delay before callbacks start, processing duration while callbacks run, and presentation delay until the browser presents the next frame.
Use the largest phase to decide where to inspect next.
| Phase that dominates | What it means | Where to look |
|---|---|---|
| Input delay | The main thread was busy before your handler could start | Tasks immediately before the interaction, script evaluation, timers, other callbacks |
| Processing duration | The event callbacks themselves took too long | Click, pointer, key, input, or change handlers and the functions they call |
| Presentation delay | The browser spent too long getting the next frame ready | Style recalculation, layout, paint, large DOM updates, rendering work |
Chrome's Performance panel exposes this split in the Interactions track. The Performance panel reference (opens in a new tab) shows the input and presentation whiskers and the phase timings in the interaction tooltip. Chrome 132 added phase timings to live interaction metrics, so screenshots from older Chrome versions can look different; see the Chrome 132 DevTools notes (opens in a new tab).
A quick PerformanceObserver can help when you want event timings in the Console while reproducing a control. Treat this as a diagnostic view, not as your field INP implementation.
const observer = new PerformanceObserver((list) => {
  for (const entry of list.getEntries()) {
    console.log({
      event: entry.name,
      total: entry.duration,
      input: entry.processingStart - entry.startTime,
      processing: entry.processingEnd - entry.processingStart,
      presentationApprox: Math.max(
        0,
        entry.startTime + entry.duration - entry.processingEnd
      ),
    });
  }
});

observer.observe({
  type: "event",
  buffered: true,
  durationThreshold: 16,
});
The Event Timing API allows durationThreshold for event entries, with 16 ms as the lowest value. Event durations are rounded, so the presentation value above is approximate. Raw event timing also has measurement limits, so do not turn this snippet into your own INP calculator.
Isolate the long task that overlaps the interaction
Once you know the slow phase, stay on the same trace. A long task is main-thread work lasting at least 50 ms. Current DevTools marks long tasks in the Main track with a red triangle and shades the portion beyond 50 ms.
Use this sequence:
- Select the slow interaction in the Interactions track.
- Align its timing with the Main track.
- If input delay is high, inspect the task running before the event callback starts.
- If processing is high, expand the event task and follow its call tree.
- If presentation is high, inspect style, layout, and paint work after the callback.
- Record the narrowest useful owner: script URL, function, plugin asset, theme asset, or browser rendering work.
A script filename can suggest ownership, but it does not prove that a whole plugin is the problem. The useful finding is narrower: this interaction waited on this task, or this handler caused this rendering work.
Third-party JavaScript can compete for main-thread time too. At this stage, record which external task overlaps the interaction. Leave the wider business decision about removing or replacing that script for a separate audit.
Use field attribution when the slow interaction will not reproduce
A lab trace is controlled. Field INP comes from visitor sessions with their own devices, network conditions, page states, and behavior. The web.dev guide to lab and field differences (opens in a new tab) notes that CrUX field reports use a 28-day distribution, while a lab run uses one controlled setup.
CrUX can tell you that a page or origin has an INP problem, but it cannot identify the exact cause. If you collect your own real-user monitoring, the web-vitals attribution build can add the interaction target, interaction type, and the three phase durations. The current API is documented in the official GoogleChrome web-vitals repository (opens in a new tab).
import { onINP } from "web-vitals/attribution";

onINP(({ value, attribution }) => {
  console.log({
    inp: value,
    target: attribution.interactionTarget,
    type: attribution.interactionType,
    input: attribution.inputDelay,
    processing: attribution.processingDuration,
    presentation: attribution.presentationDelay,
  });
});
Use that data to group slow sessions by page and interaction target, then reproduce the same control in DevTools. Do not send form values or other user-entered content as diagnostic labels. Keep your existing consent and analytics rules intact when you add performance telemetry.
A Lighthouse run or a single DevTools trace is lab evidence. Do not describe its score as an INP field measurement. Field and lab data answer different parts of the diagnosis.
Can content-visibility improve INP in WordPress?
It can help when presentation delay is the problem. content-visibility: auto lets the browser skip rendering work for offscreen content until that content is needed. web.dev lists it as a way to reduce rendering work that can affect INP.
Use it as a controlled test on long pages with expensive offscreen sections. If presentation delay falls while input and processing stay similar, the trace supports that direction. If a JavaScript handler dominates, content-visibility is aimed at the wrong phase.
Retest keyboard access, focus behavior, dynamic sections, and the same menu or form path after the CSS change. A rendering optimization is only useful if the interaction still works.
Retest the function before you trust the faster trace
After one controlled change, run the exact same mobile sequence and fill the "Expected after change" column. The expected result is lower time in the phase you targeted, with the feature still behaving the same way.
Check the paths that often break when interaction code changes:
- Open and close the menu with touch and keyboard controls.
- Type, delete, Tab, and submit in the form.
- Repeat the consent choice from the same starting state.
- Confirm the intended analytics event still fires once, with the expected shape.
- Repeat any interaction that was delayed until first input.
Then compare field context. CrUX will not change immediately because it summarizes a rolling 28-day field distribution. Your own RUM can provide more direct interaction attribution if you already collect it.
This also explains why INP can get worse while page-load metrics barely move. A new key handler, menu callback, tag, or DOM update can add work only when the visitor interacts. The initial loading path may remain almost unchanged.
Decide what to fix next
If the trace points back to loading the main visual content rather than click or typing responsiveness, use the WordPress LCP image optimization guide for that separate problem. To set phase targets before another pass, the Core Web Vitals budget calculator splits INP into input, processing, and presentation budgets.
If the slow path crosses theme code, plugin JavaScript, and browser rendering work, WordPress performance optimization can use the same trace to scope the fix without changing unrelated parts of the site.
Frequently asked questions
Should I disable WordPress plugins one by one to find poor INP?
Use a staging copy and change one suspect at a time after you have a trace that points to it. Blindly disabling plugins can change the page enough that you lose the original interaction path, so keep the menu, form, consent, and analytics behavior comparable.
Can page caching fix poor INP in WordPress?
Do not assume it will. If the trace shows expensive event callbacks or rendering after the click, page caching does not remove that browser work, so use the phase breakdown to decide where the fix belongs.
How long until PageSpeed Insights reflects an INP fix?
A local interaction trace can show the expected direction as soon as you retest the changed code. CrUX field data is aggregated over a 28-day period, so its reported distribution changes gradually as new visits replace older ones.
Does INP measure slow scrolling?
INP observes clicks, taps, and keyboard interactions. Scrolling and hovering are not measured as INP interactions, although work triggered around them can still keep the main thread busy and delay a later measured interaction.
How this article was made: drafted with AI assistance from a researched brief, then checked against primary documentation before publishing.
Share this article
Enjoyed this? Get the next article by email.
Keep reading
 Performance
8 min read
WooCommerce cart fragments: what they cost and when to remove them
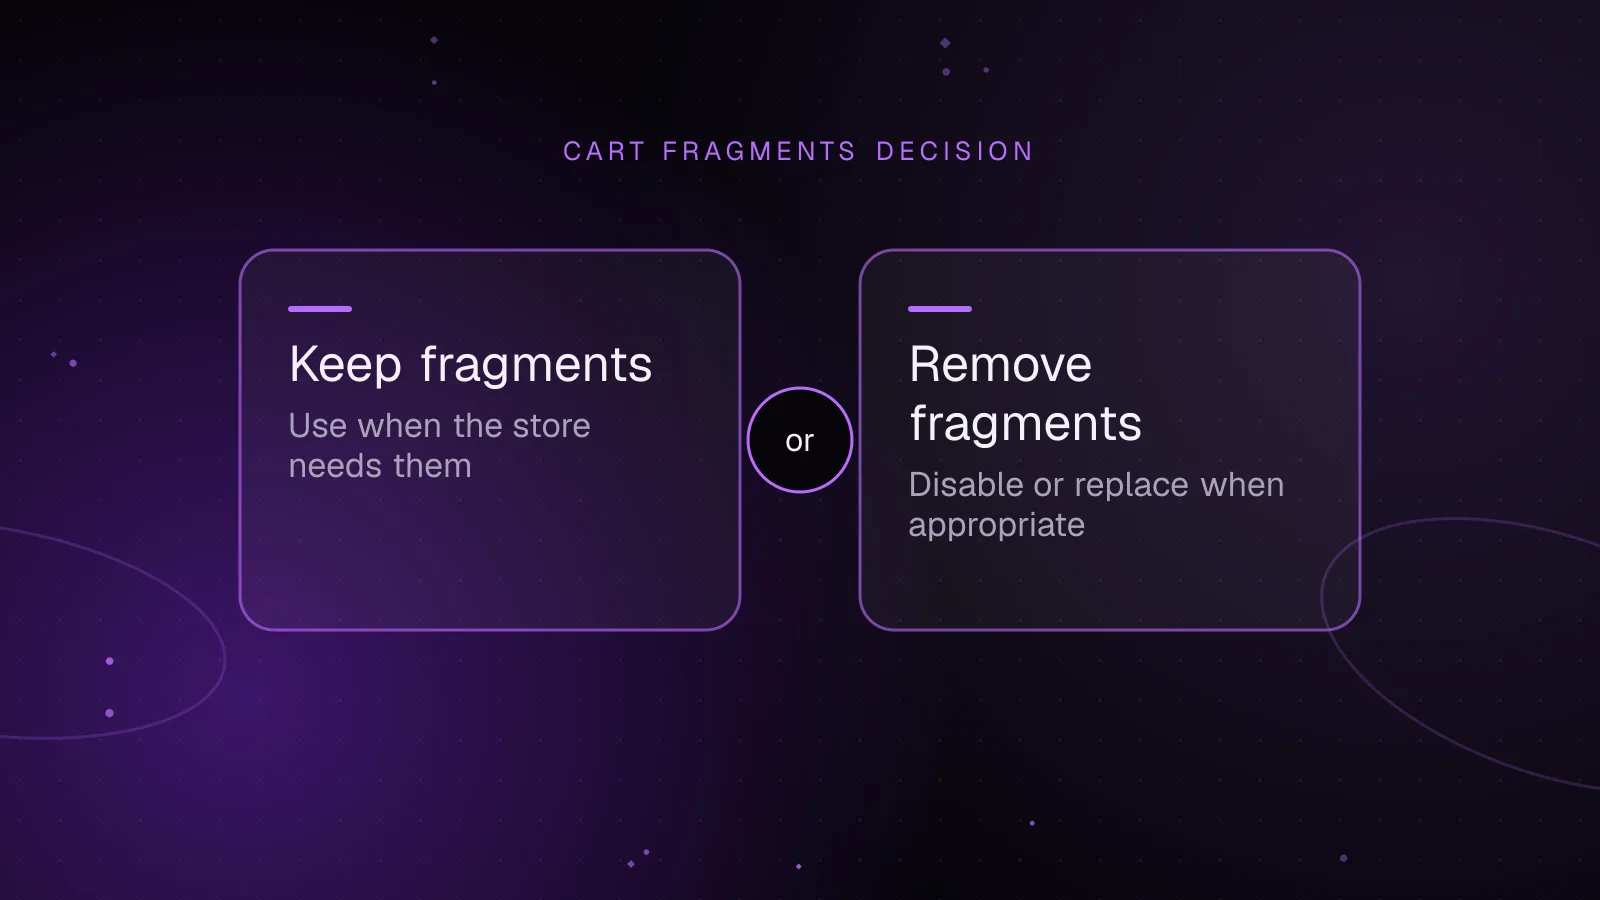
WooCommerce cart fragments keep a legacy mini cart synchronized after cart changes, but the refresh request reaches PHP and cannot use a normal full-page cache.
- WooCommerce
- Performance
- Caching
 Performance
7 min read
WordPress LCP image optimization: make the largest image load first
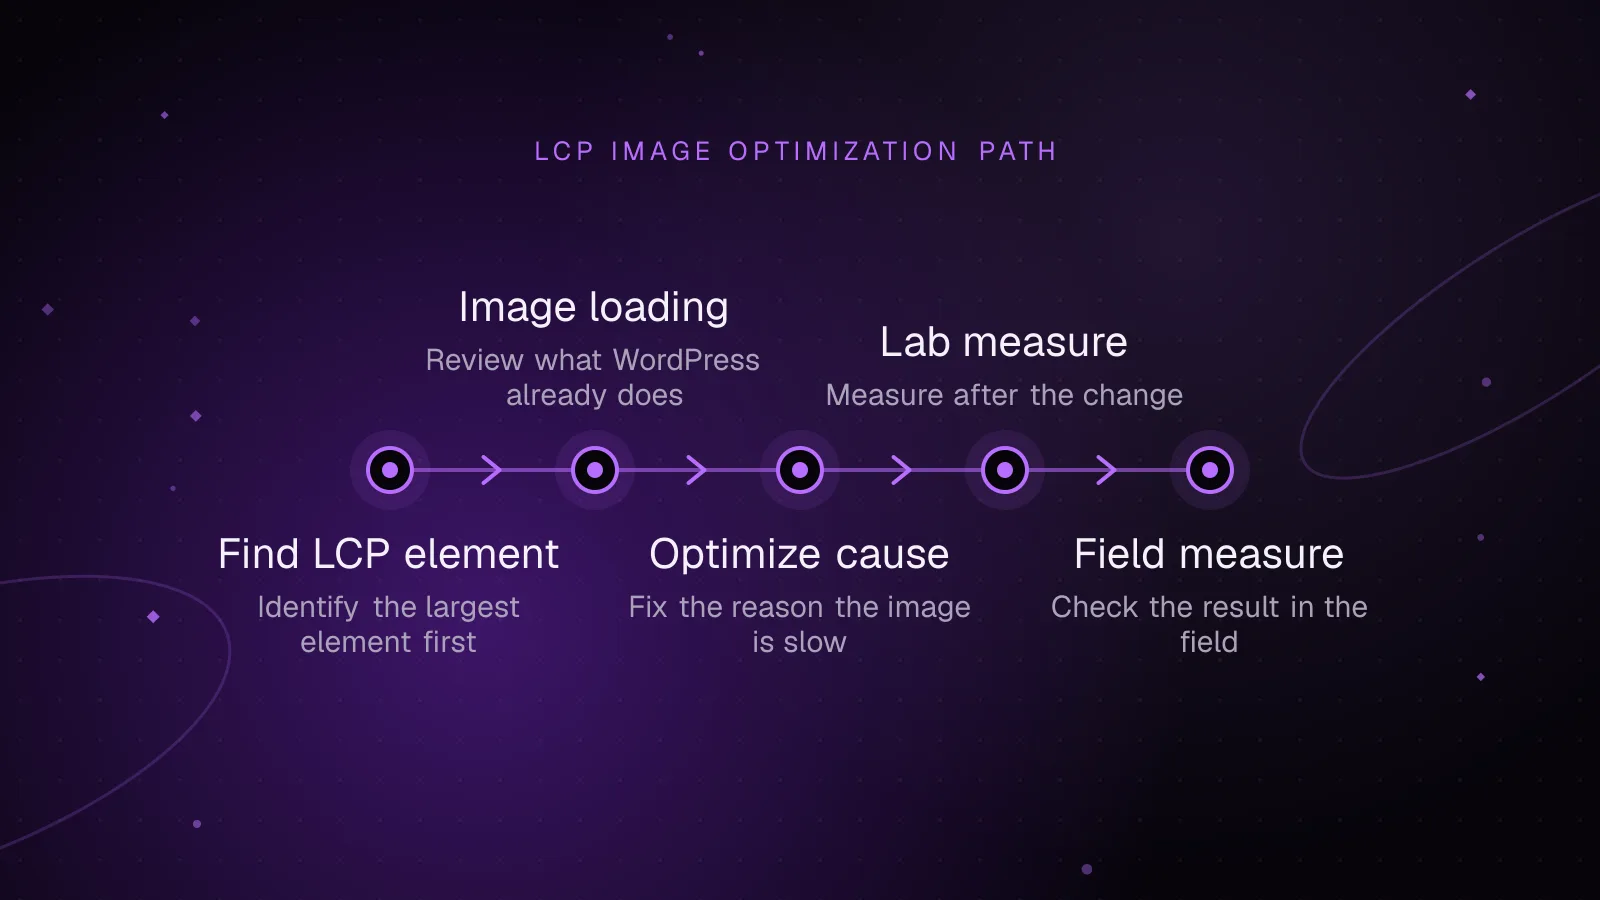
A slow WordPress LCP image usually needs three things: early discovery, high fetch priority, and a file sized for the space it occupies. Find the actual LCP element first, then remove accidental lazy loading, fix responsive image markup, preload late-discovered backgrounds, and retest.
- WordPress
- Core Web Vitals
- Performance
 Performance
7 min read
WordPress speculative loading: faster navigation without breaking a store
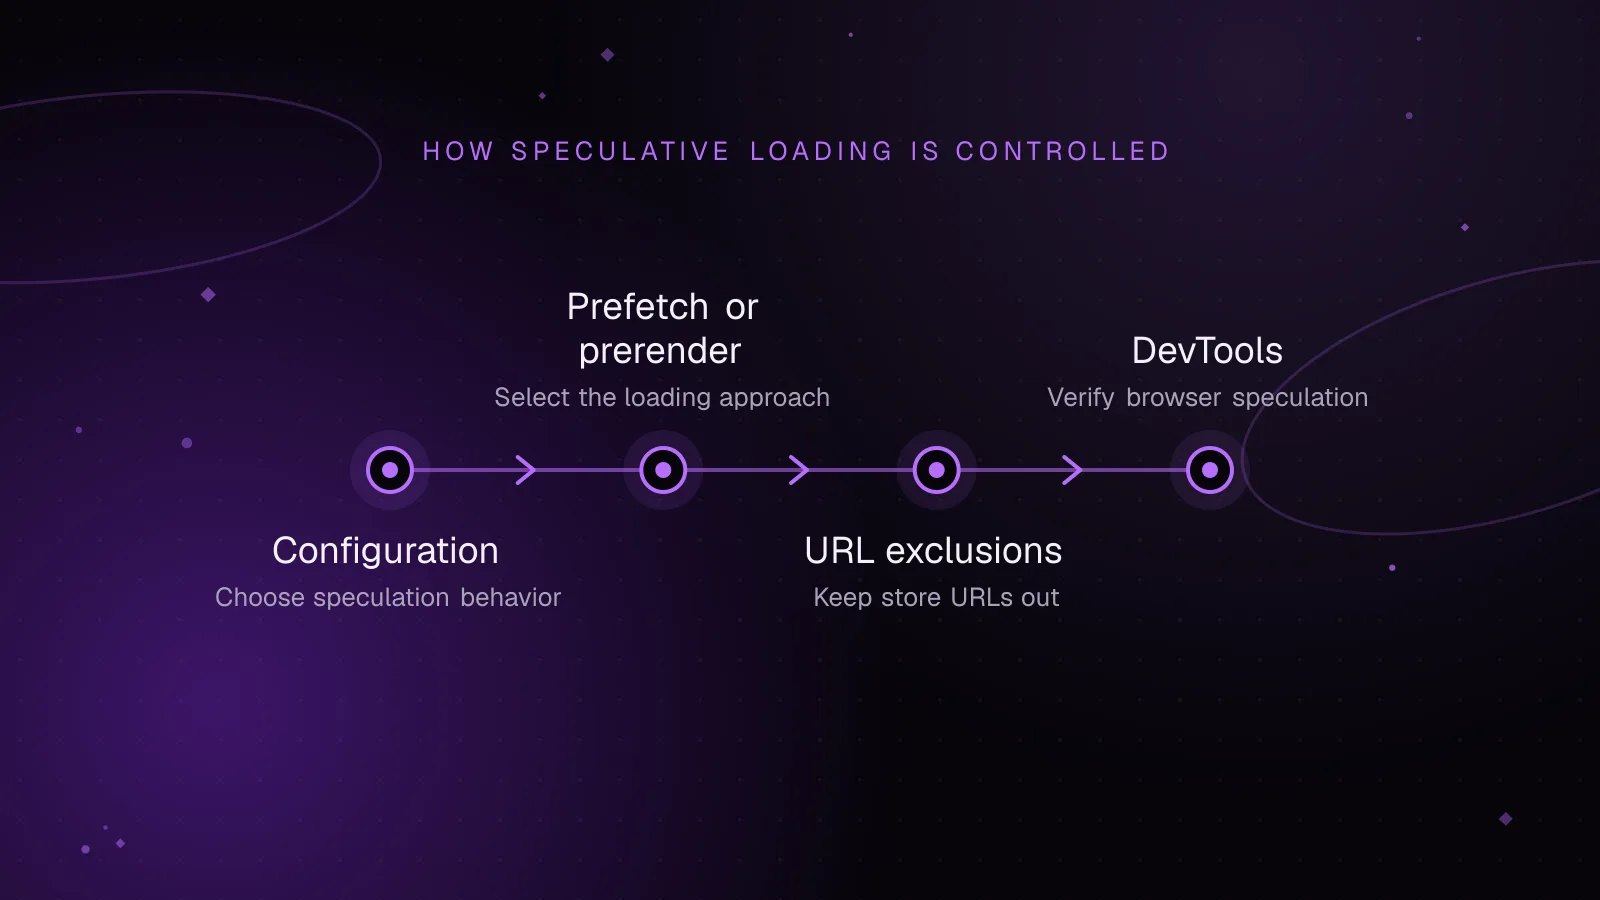
WordPress speculative loading can make page-to-page moves feel faster by asking the browser to fetch likely destinations before a visitor clicks. On a WooCommerce store, keep dynamic and state-changing URLs out of those rules, then verify what Chrome loads before making the behavior more eager.
- WordPress
- Performance
- WooCommerce